 UK cyclists often gaze enviously over statistics in the media, quoting Dutch cities as the ultimate paradigm for those relying on pedal power. Figures of between 25- 50% for journeys by bike are often bandied about, often with a range of simple-sounding explanations; the Dutch are ‘greener’, the country is flatter, they have more cycle lanes, they invest more money in facilities.
By comparing two ‘cycling cities’ both here and in The Netherlands, a more complex but more interesting picture emerges. Nottingham is historically associated with the name of Raleigh cycles (although these are now made in the Far East) and over the last two decades the city council has made some effort to accommodate cyclists in its transport policy. Groningen, on the other hand, has attained almost mythical status in the cycling world since the late 70s, having managed to curb car use and encourage a huge uptake in both walking and – especially – cycling.
OK, so the comparison may be a little unfair, as most places fall short of the standard set in the northern Netherlands city and Nottingham cannot claim automatic status in the premier league of English cycling cities, such as York, Cambridge or Oxford. But truth be told, it is probably a more typical example of the efforts being made by British local authorities struggling to get more than a tiny proportion of the population out of cars and onto bikes. In many basic respects though, the cities are broadly similar, so in theory there is no inherent reason why Nottingham couldn’t become the UK’s first Groningen. Both cities are ‘county’ capitals with a population in the greater urban area of between 400,000 and 500,000. Both have some income from tourist visitors but both are predominantly working towns where the transport network is for the use of people who live and work in the area.
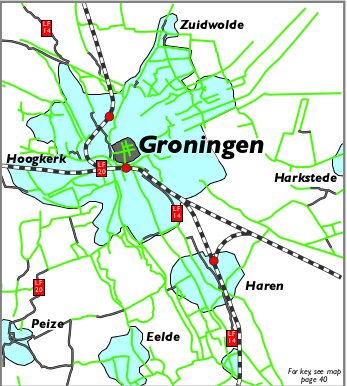
GRONINGEN - a true network. Cycle routes are mostly segregated and link the heart of the city with outlying suburbs, industrial estates, schools and leisure facilites
GRONINGEN – Gridlock to Cycle Nirvana
Reading about the city’s rise to star status in cycle usage terms it becomes clear that Groningen’s hallowed reputation is no accident. For much of the 1970s it was feared that growth in motor traffic would overwhelm the city and at that stage there was no reason to suppose they would progress beyond the UK’s current general attitude of recognising the problem but being chronically incapable of doing anything about it. Groningen’s current percentage of daily journeys by bike (often quoted at between 50% and 60%) seems to have been due to a definite and deliberate policy by the local city council based on the following:
1. Motor traffic was regulated and often deliberately excluded from certain city areas. The ball was set rolling in 1977 when the City Council sprang into action by digging up and removing a six-lane highway in the city centre to replace it with a more human landscape of greenery,Watnall bus lanes and pedestrianization. Subsequently, manyBurton roads were narrowed to reduce motor traffic speed or even shut entirely to motorJoyce traffic.Thirty kmh (19mph) limits on minor roads, and especially in residential areas, became the norm.
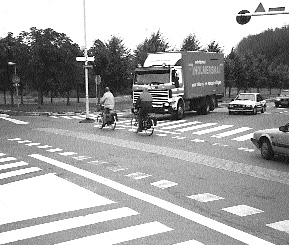
The key to the success of the Dutch model is that cyclists have priority to motor traffic. This is even true at major intersections, although motorists do not always obey.
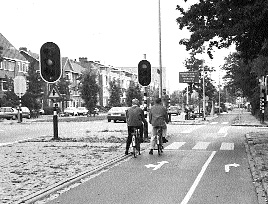
At light-controlled crossings, the cycle lane is marked across the carriageway to reinforce the point. As a result, cycle lanes are much safer and easier to use than in the UK
From 1990 the city was divided into ‘pie sectors’ whose boundaries could not be crossed by private motor traffic so that now, not only are motor journeys to the city centre highly regulated, but so are ‘cross town’ trips. The pedestrian area was extended (also fully open to cycles) and thousands of trees were planted. This ‘sectoring’ was highly contentious at the time but in the long term the city continued to thrive, and the number of visitors has actually increased. More ‘car-clearing’ programs are planned and in future visitors by car will most likely be required to park on the outskirts in one of several large multi- story car parks in a ‘park and ride’ scheme.
…it was seen as a replacement to car provision, rather than an additional cost…
2. Land use planning became geared towards sustainable transport. Siting of buildings and their function determines how far people have to travel and by what means.This simple credo means that major buildings, be they industrial, civic or cultural should be next to or very near the main cycle and public transport routes. From 1991 a ‘restrictive’ parking policy for businesses was introduced – new labour-intensive businesses were allowed only one parking space for every ten employees, less labour-intensive businesses were allowed one space for every five employees and businesses with a high interest in lorry/car access and with low labour intensity had no parking standard and were located on industrial sites. In practical terms this planning policy led to the concentration of development around the station area, with a mix of buildings including housing, shops, offices and cultural centres.The parking standard of one space per ten people was applied. Shuttle services and coordinated car pooling (with its own council officer) transport people between the station and outlying areas.
3. Cycle use was positively encouraged by the development of an integrated cycling infrastructure.This had the advantage, after initial capital costs, of being cheaper than a car- orientated infrastructure to run. Crucially it was seen as a replacement to car provision, rather than an additional cost, as often happens in the UK.A ten-year cycling plan cost around £18 million, with the stated aim of bringing the existing cycle network ‘to perfection’.The emphasis has been on producing an interconnected ‘spider’s web’ of suitable routes, both alongside main roads into the city but also with numerous radial connections. The ‘car clearing’ policy has helped, by giving the high quality cycle paths priority over motor traffic at junctions. Groningen has also provided cycle signing, cycle traffic lights and secure, often guarded and sheltered, cycle parking.
Moreover, arresting and reversing car growth wasn’t simply seen as a transport or even just a planning issue, but central to the city council’s main aims in city planning; their master plan, or ‘Struktuurplan’ has two overriding aims that drive policy in all areas: firstly, Groningen’s central economic and cultural position should be strengthened, and secondly, the quality of life should be enhanced.
Of course, such words could easily be a wishy-washy vote-catching commitment, but determined and largely successful efforts to curb car use and encourage other forms of transport suggest that it’s not so. Perhaps most interestingly, when contrasted with the UK, encouraging walking and bike use was and still is seen as central to economic progress and quality of life in Groningen. Motoring lobbies and many sectors of the economy (witness the fuel protests) over here would have you believe that curbing motor traffic is economic suicide.These detractors did exist in Groningen, which makes the city council’s forthright attitude all the more commendable. Initially public reaction was generally hostile to the plans, but now the council receives numerous requests from residents and businesses alike to ban traffic in their street and ‘bicyclise’ it!
Effect on National Policy
It was only as recently as 1989 that the national government of The Netherlands committed itself to abandoning a policy that catered for a growth in motor traffic and pledged itself and its finances to encouraging all alternative means of transport.The national average for cycling trips is now around 25%, with many committed cities such as Delft able to reach 40%. Groningen’s brave lead paid off as well – after the national government’s change of heart it agreed to pay for 80% of the city’s cycle infrastructure which otherwise would have all come from city coffers. Poetic justice indeed.
NOTTINGHAM – The First Steps?
First-hand experience tells me that Nottingham is a great place to cycle if you want a pleasant day out pootling around the castle and then out to the fine Elizabethan Wollaton Hall. Of course this is not the same as living there and trying to get around by bike – no doubt a typically frustrating English cycling experience. Frustrating in the sense that the city has some excellent schemes and has shown genuine commitment, but has failed to follow through in the Dutch style. Despite a valuable attempt at cycling provision, statistically the city remains stuck in the doldrums along with much of the rest of the UK at around 2-4% of trips made by cycle.
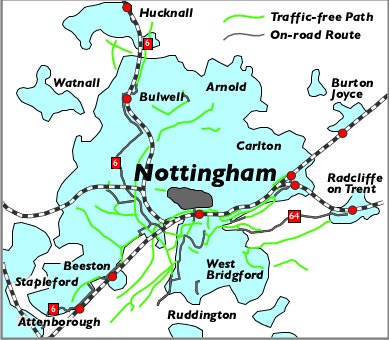
NOTTINGHAM - far fewer cycle routes and the principle examples are leisure orientated, reaching into open country rather than outlying conurbations. Some, such as Sustrans Route 6 are wastefully shadowed by local authority and Dept for Transport routes. Remarkably, no routes penetrate the city centre.
Nottingham’s Cycling Story
Comparing the cycling histories of Nottingham and Groningen, one overwhelming fact stands out.The ‘Dutch’ model is one largely planned and implemented under the direct, central leadership of local government (albeit with other groups involved), whereas Nottingham is a much more ad hoc affair with pro-cycling groups of one sort or another trying to squeeze concessions from the powers that be, who often seem to view cycling provision as an unnecessary expense, despite paying political lip-service to ‘green’ ideals.
Glance at the number of bodies involved in Nottingham and you begin to see the inherent complexity involved in building a cycling programme; several local authorities (some more committed than others), Pedals (Nottingham’s cycling advocacy group), Sustrans, the Highways Agency, the Department for Transport, British Waterways, Cleary Hughes Associates (cycle planning consultants) and various bicycle user groups and local employers. All were, at one time or another, working on such schemes as the Greater Nottingham Cycling Project, the Nottingham section of the Millennium Cycle Route, Cycle Challenge, Green Commuter Plans, the STEPS initiative, local transport plans (including cycling and walking strategies), the Work Wise project (lending/hiring bikes), the Homezones project and the Clear Zones project (you can breath in now). At times the system resembles not so much the left hand not knowing what the right hand is doing but an octopus trying to go in several directions at once.
…the Highways Agency is one of the biggest problems in implementing proposals…
But in the context of our public/private, lobby-led political system, much has been achieved by committed bodies in Nottingham. Since the early 1980s, starting from a base of almost nothing, greater Nottingham now has over 100km of cycle network in place, an impressive increase in cycle parking and information services such as city route maps, learning to ride classes and organised rides.Yet despite all this, cycle use remains stubbornly low, suggesting that the real cause of these low rates (roads that are relatively unsafe for cyclists) remains.
Achievements and Obstacles
The construction of a well-signed skeleton network of recognised cycle routes must count as a major achievement. Cyclists in most British cities will be familiar with the system to a greater or lesser degree, pieced together from such things as canal towpaths, ‘on road’ cycle lanes, bus lanes, pavement cycle lanes and increasingly nowadays, traffic- calmed minor roads.The main cycling arteries head into the centre from the south-west along the canal and River Trent, and from the north-east along the ‘mixed’ style Millennium Cycle Route, although cycling connections from the east lag behind.The programme also included some cyclist-friendly traffic engineering features, such as combined cycle and pedestrian crossings (toucans), advanced stop lines and cycle contraflows. Sadly and not unpredictably, many of those involved in promoting positive measures found the Highways Agency – the central government body responsible for the country’s main roads – to be one of the biggest problems in physically implementing agreed proposals. Several long trunk road cycle schemes are still held up by the Agency.
Similarly, some of the local councils surrounding the city proved more positive than others (a pattern repeated across the whole of the UK). Such factors have lead to a lack of routes to the north and east of the city. Here one local council remained adamant cycling was not a priority due to the hillier nature of the terrain; a case for promoting electric bikes surely! Outlying councils also seem to lag behind the City Council in providing facilities such as parking.
…Despite evidence of increasing use… rates of cycling have not rocketed Dutch style…
Most notably there has been a big effort in Nottingham to encourage employers to Nottingham – An example of British best practice, but the underlying message is that cars have priority joint-fund cycling schemes.Various councils, teaching and health institutions and two large private firms between them had a work force of 32,000 (77,000 if students are included) who were encouraged to cycle to work with such incentives as free loans for bike purchase, bike mileage allowances, secure parking, free showers and bikers’ breakfasts.
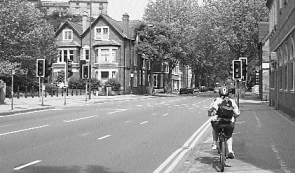
Nottingham - An example of British best practice, but the underlying message is that cars have priority
The Future
Despite evidence of an increase in use of the network, overall rates of cycling have not rocketed Dutch style. Crucially, political will seems, at best, lacking and at worst deliberately obstructive.This means vital areas such as planning often totally overlook the transport implications of their decisions, a pattern repeated right across the country. As Hugh McClintock, a Nottingham-based planning expert comments, ‘Arguably the most fundamental challenge in encouraging cycling is to reverse, through land use planning and other measures, the continuing trend… to longer trip distances, which are harder to cover on a bike… In 1991 only 47% of people working in Nottingham City lived there, compared to 53% in 1981.’
Cycling is not an optional add-on to transport policy. As in The Netherlands, it should be funded in a large part by central and local government and not left to committed bodies of experts and volunteers to struggle against the established order. It should be seen as integral part of the bigger picture.
Thanks to Hugh McClintock for information provided and for writing and editing the excellent ‘The Bicycle and City Traffic’ (1992 Belhaven Press – out of print) and its successor ‘Planning for Cycling’ (2002 Woodhead Publishing Ltd). All views in this article however, are those of the author.
219 total views , 2 views today